How Long Did My Test Take?
When submitting a new unit test, it’s not necessary to worry too much about how long the test takes because there’s no real hardware involved so the unit tests execute super-fast.
However, when you are adding a test that runs either per patch or on a nightly basis (one that uses real hardware) it’s very important to understand how long the test takes. It’s far too easy to unintentionally increase the per patch or nightly tests by an amount that will either cause the series of tests to timeout or simply waste valuable limited resources in the test pool.
When adding a test that does IO to an NVMe-oF target, for example, you might run FIO for 30 seconds thinking you’ve added only 30 seconds when in reality you may have added up to 3x that (or more) because of the time it takes for the automated software to setup the test bed.
Fortunately there’s an easy way in the SPDK CI system to see how long any specific timestamped series of commands takes. For this to work, all you have to do is make sure you surround the code that invokes your tests with timing enter and exit functions. You do this in the shell script that you’ve added or modified while adding your test.
For example, in spdk/test/nvmf/nvmf.sh, you can see examples of this:
timing_enter nvmf_tgt
...your code...
timing_exit nvmf_tgt
And you can nest these statements as well.
Once you’ve done this and submitted your patch, you can use timing charts that are automatically generated as part of the CI process to see how long things are taking. To get to the timing charts, start by finding your patch on GerritHub.
Now find your +1 verified link to the build output as shown below:

Next, you need to figure out which test system actually executed your test as not all test systems run all tests. You can look at the test system descriptions, as shown below, to help make that determination. Otherwise you can just look through all of them until you see your timing labels. Click on the test system once you find it.

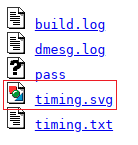
In the directory listing, you’ll see the file timing.svg; click on it.

Now you will see the timing chart showing the test time per block as defined by the timing labels described earlier. As you mouse-over each block you will see the test time for that block and all those above it.

So now what? This information isn’t very useful without a baseline so you also need to see the pictures without your test added. Well, on that same CI Status page you will see a link in the upper right hand part of the screen to to a patch (it will be different every time depending on what ran last) that starts with the text “Latest master build is”. If you click on that link, you’ll see the last master build and can look at those timing diagrams and compare to yours. You may need to consider how long it’s been since yours ran. If, for example, some things changed that affect the timings you are interested in you’ll need to rebase your patch and re-run.
Good luck and have fun!