spdk_top - what's new in 21.01
In SPDK’s 21.01 release spdk_top received a few improvements that we’re excited to share.
Improvements
First, the menu at the bottom has been extended with several new options:

The pollers tab also has a new column showing whether each poller is considered idle or busy.
New Features
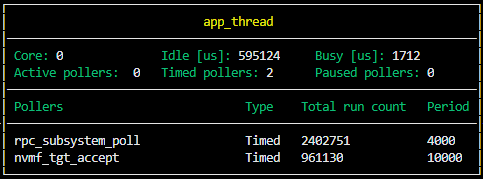
Now spdk_top allows rows to be highlighted using the arrow keys. Pressing Enter will pop-up additional details about the selection.
Here’s what it looks to highlight and select a row in the threads tab:


And here’s what it looks like on the pollers tab:


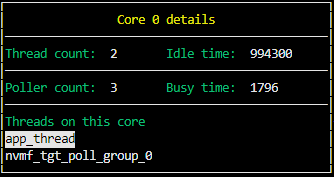
Finally, the cores tab:


The pop-up on the cores tab is unique because it has its own nested selection and highlighting. This is convenient to quickly select a thread for statistics without switching over to the threads tab. When selecting a thread from this pop-up menu and pressing Enter, the same pop-up from the threads tab will be displayed.
There are now two viewing modes in spdk_top.
- Data collected since the start of the application
- Data collected since the last refresh
We believe spdk_top is an excellent tool for viewing the real time performance characteristics of SPDK applications, but it can always be better. Please contribute either code or ideas!
Need more details? Click here to learn more!